Data Analytics: What It Is, How It’s Used, Types, Features, Tools and Techniques

- Understanding Data Analytics
- Why is Data Analytics Important?
- What is the Role of Data Analytics?
- Process of Data Analytics: How Does Data Analytics Work?
- Types of Data Analytics
- Key Features of Data Analytics
- Data Analytics Methods and Techniques
- Top Tools for Data Analytics
- Data Analytics Comparison
- Benefits of Data Analytics
- Applications of Data Analytics: How Data Analytics is Used?
- How is Data Analytics Used in Business?
- Real-World Examples of Data Analytics
- Challenges and Limitations of Data Analytics
- Future Trends in Data Analytics
- FAQs about Data Analytics
- Conclusion
- Maximize Your Potential: Embrace Data Analytics with BuzzyBrains Today!
Understanding Data Analytics
Data analytics is the science of analyzing raw data to discover patterns, derive insights, and make data-driven decisions. It involves using specialized techniques and tools to clean, inspect, transform, model, and visualize data.
With the right analytics, data can reveal valuable insights for everything from business strategy to scientific research. But making sense of vast amounts of data requires the right analytical approach.
Why is Data Analytics Important?
Data analytics is important because it enables businesses and organizations to make smarter decisions. With the ability to measure and optimize processes based on performance data, companies can improve operations, target customers more effectively, and boost their bottom line.
Some key reasons why data analytics matters for business growth include:
- Identify opportunities and trends
- Guide strategy and planning
- Optimize marketing campaigns
- Personalize customer experiences
- Improve products and services
- Detect fraud and risk
- Streamline operations
- Predict future outcomes
What is the Role of Data Analytics?
Data analytics plays various roles across industries. Some key aspects include:
- Descriptive analytics to understand what happened
- Diagnostic analytics to understand why something happened
- Predictive analytics to forecast what could happen
- Prescriptive analytics to recommend what should be done
- Automated decision systems to take real-time actions
- Data mining to discover hidden patterns and correlations
- Optimization of business processes
- Segmentation of customers and products
- Sentiment analysis from social media conversations
- Fraud and anomaly detection
Process of Data Analytics: How Does Data Analytics Work?
For data to be converted into meaningful information, there are various sub-processes that have to be undertaken. The data analytics process typically involves the following key steps:
1. Data Collection: Gather important data from diverse sources such as databases, APIs or sensors.
2. Data Cleaning: Remove inconsistencies, errors and outliers within the data collected for accuracy necessitation.
3. Data Processing: Refashion the cleaned data into a suitable format for analysis.
4. Data Analysis: Use statistical and computational methods to scrutinize the processed data and bring out patterns, trends and correlations which can be used to draw conclusions.
5. Data Visualization: Represent analyzed information using graphical display on charts, graphs or dashboards for ready understanding and interpretation by others.
6. Data Interpretation: Elucidate Decision Making resulting from Data Presented Graphically .
This lifecycle enables businesses to tap into data analytics for ongoing optimization and innovation. The process requires coordination across teams to ensure alignment between technical and business goals.
Types of Data Analytics
There are three main types of data analytics:
1. Descriptive Analytics: Summarizes what happened in the past using historical data. Metrics and reports are used to understand performance.
2. Diagnostic Analytics: Analyzes past data to understand why something happened. Drills down into factors behind metrics.
3. Predictive Analytics: Uses statistical and machine learning models to forecast future outcomes and trends. What could happen next?
4. Prescriptive Analytics: Combines predictive insights with business goals to recommend data-driven decisions. What action should be taken?
5. Automated Analytics: Uses AI and ML models to automatically analyze data and take actions such as predicting churn or blocking fraudulent transactions.
Each type provides additional business value and continues progressing up the analytical maturity curve.
Key Features of Data Analytics
Some key capabilities to look for in data analytics solutions include:
- Statistical analysis and modelling
- Data mining and machine learning
- Data visualization and dashboards
- Real-time data processing
- Natural language processing
- Embedded analytics and BI
- Cloud-based analytics
- Python, R and other analytics languages
- APIs and microservices architecture
- Automated insight discovery
- Flexible pay-as-you-go pricing
Data Analytics Methods and Techniques
Data analytics leverages various scientific methods and techniques including:
- Regression analysis
- Time series forecasting
- Clustering and segmentation
- Decision trees and random forests
- Text mining and sentiment analysis
- Neural networks and deep learning
- Optimization algorithms
- Statistics and econometrics
- Signal processing techniques
- Simulation and bootstrapping
- Experimental design
Choosing the right techniques depends on the business problem, data types and analytics maturity of the organization.
Top Tools for Data Analytics
Some of the top analytics tools used by data scientists and analysts include:
- Python and R for statistical modelling and machine learning
- Tableau for interactive data visualization
- MATLAB for numerical computing
- Apache Spark for big data processing
- Jupyter Notebooks for collaborative coding
- KNIME for visual workflow automation
- Microsoft Power BI for business intelligence
- SAS for advanced statistical analysis
- RapidMiner for predictive analytics
- Qlik for self-service BI
- Sisense for embedded BI
- Google Analytics for web analytics
Related Blog: Top Data Engineering Tool & Platforms: A Comprehensive Tool Guide
Data Analytics Comparison
Data Analytics vs. Data Science:
| Data Analytics | Data Science |
| Focuses on past & present data to provide insights | Uses past data to predict unknown future events |
| Descriptive and diagnostic analytics | Predictive and prescriptive analytics |
| Business facing to optimize operations | Technical and analytical skills to uncover insights |
| Uses predefined data models | Creates new statistical and ML models |
| Asks “what happened?” and “why did it happen?” | Asks “what could happen?” and “what should we do next?” |
Data Analytics vs. Business Analytics:
| Data Analytics | Business Analytics |
| Deals with data itself | Focuses on the impact of decisions on business |
| Led by data engineers and analysts | Led by departments across the company |
| Platforms like Hadoop, Spark | BI tools like Tableau, Qlik, Power BI |
| Programming languages like Python, R | Drag-and-drop self-service workflows |
| Statistical models, data mining, ML | Dashboards, reports, visualizations |
| Data quality, cleaning, preparation | Ad-hoc querying and analysis |
While interconnected, data analytics focuses more on technical capabilities while business analytics is about enabling data-driven business decisions.
Related Blog: Big Data vs Data Science vs Data Analytics: A Detailed Comparison
Benefits of Data Analytics
Adopting data analytics provides the following key benefits:
- Optimize marketing and sales
- Create personalized customer experiences
- Improve operational efficiency
- Detect fraud earlier
- Identify new revenue opportunities
- Make faster data-driven decisions
- Develop new data-centric products
- Understand customers and markets better
Applications of Data Analytics: How Data Analytics is Used?
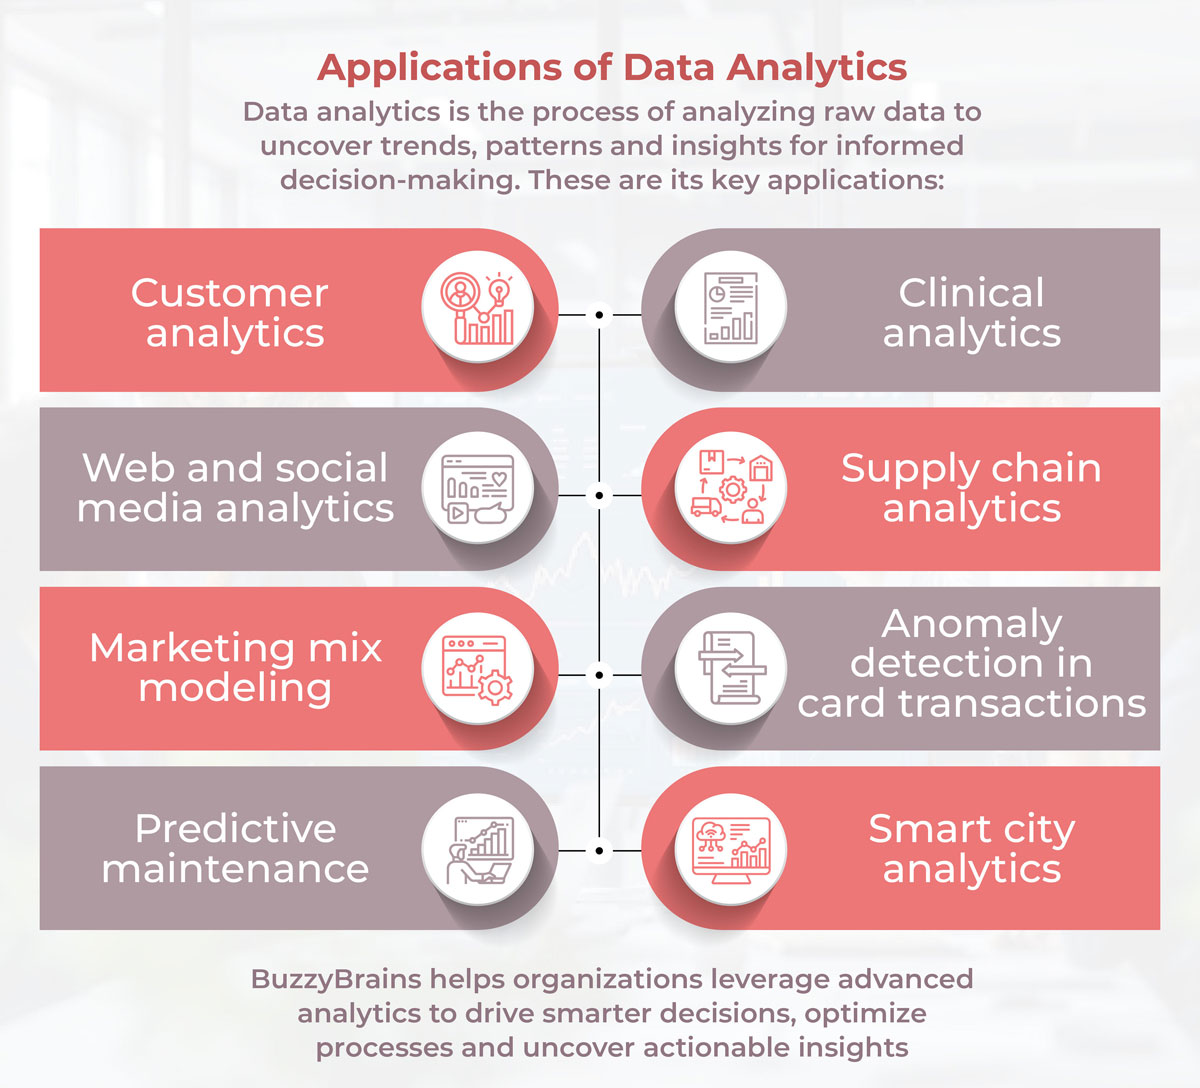
Data analytics powers a variety of applications across domains including:
- Customer analytics to optimize marketing campaigns
- Web and social media analytics to understand brand sentiment
- Marketing mix modelling to size impact of initiatives
- Predictive maintenance to detect issues proactively
- Clinical analytics to improve healthcare outcomes
- Supply chain analytics to identify bottlenecks
- Anomaly detection in credit card transactions to prevent fraud
- Smart city analytics to optimize energy usage

How is Data Analytics Used in Business?
Data analytics helps drive business success in various ways:
- Customer Intelligence: Identify high-value customers, understand buying behaviour, prevent churn
- Fraud Detection: Detect credit card, healthcare or identity fraud earlier
- Operational Efficiency: Reduce costs with optimized forecasts, staffing and inventory
- Personalization: Provide customized content and product recommendations
- Innovation: Develop data-driven products, services and business models
- Smart Decision-Making: Guide strategy with data-backed projections and scenarios
Real-World Examples of Data Analytics
Here are some real-world examples of brands using big data analytics:
1. Netflix: Recommends shows and movies based on complex algorithms analyzing user behaviour and activity. This accounts for a huge portion of content watched on Netflix.
2. Uber: Leverages predictive analytics to accurately forecast rider demand at a granular level, allowing them to efficiently match supply and demand for rides.
3. Nike: Uses customer analytics across the web, social media, and stores to deliver personalized offers and product recommendations, leading to higher engagement.
4. Amazon: Its state-of-the-art analytics systems leverage recommendations, fraud detection, inventory optimization, dynamic pricing, and more to maximize operational efficiency.
5. Tesla: Collects sensor data from customer vehicles to continuously improve autopilot algorithms using machine learning and deep learning techniques.
6. MasterCard: Employs neural networks and ensemble models to detect up to 80% of fraudulent transactions accurately before they happen.
Challenges and Limitations of Data Analytics
While powerful, data analytics has some key challenges:
- Building and maintaining data pipelines
- Dealing with poor data quality
- Discovering meaningful insights
- Last-mile adoption across the organization
- Communicating insights to drive action
- Ethical use of data analytics
- Lack of analytical skills and data literacy
- Securing confidential data
- Integration across fragmented analytics systems
Future Trends in Data Analytics
Some emerging trends shaping the future of data analytics include:
- Democratization for wider business user adoption
- Automated AI/ML analytics built for business use cases
- Conversational analytics through natural language
- Streaming and real-time analytics
- Focus on data governance and trust
- Hybrid cloud and multi-cloud architectures
- Everything-as-a-Service and embedded analytics
- Blockchain-based data marketplaces and exchanges
- Rise of data meshes and decentralized data platforms
FAQs about Data Analytics
Q1. How does data analytics help in decision-making?
Data analytics supports decision-making by deriving actionable insights from data. It provides metrics, trends, forecasts, and recommendations that leaders can use to guide strategy and planning. Data-driven decisions are more objective and optimized than intuition or gut feeling.
Q2. What are some key performance indicators (KPIs) used in data analytics?
Some common KPIs used in data analytics include:
- Customer lifetime value
- User engagement metrics
- Conversion rates
- Sales and revenue by product line, geography etc.
- Churn rates
- Inventory turnover
- Forecasting accuracy
- Marketing campaign ROI
- Customer satisfaction (NPS) scores
Q3. What is the difference between descriptive and predictive analytics?
Descriptive analytics uses historical data to find patterns and provide insights into what happened. Predictive analytics uses statistical models and machine learning to analyze current and historical data to forecast future outcomes and trends.
Q4. How does data analytics differ from business intelligence?
Data analytics focuses on statistical analysis and modelling using programming languages. Business intelligence emphasizes easy-to-use dashboards and visualizations for business users to analyze data themselves.
Q5. What role does machine learning play in data analytics?
Machine learning powers predictive analytics by detecting complex patterns from large volumes of data that would not be possible with traditional analytics. It enables capabilities like forecasting, personalized recommendations, sentiment analysis, image recognition and more.
Conclusion
Data analytics unlocks immense opportunities for businesses to optimize operations, understand customers, personalize experiences, develop innovative offerings, and disrupt markets. By following a methodical analytics lifecycle, companies can embed data-driven decision making into their DNA. With the right talent, culture, and technology, data analytics delivers a significant competitive edge.
Maximize Your Potential: Embrace Data Analytics with BuzzyBrains Today!
The data analytics journey requires the right mix of strategy, execution, and platforms. BuzzyBrains can help bring it all together by assessing your analytics readiness, building roadmaps, implementing solutions, and upskilling your teams. Contact us today to start amplifying your business with advanced data analytics. Our comprehensive capabilities and accelerated approach help leading organizations realize the full potential of their data.
